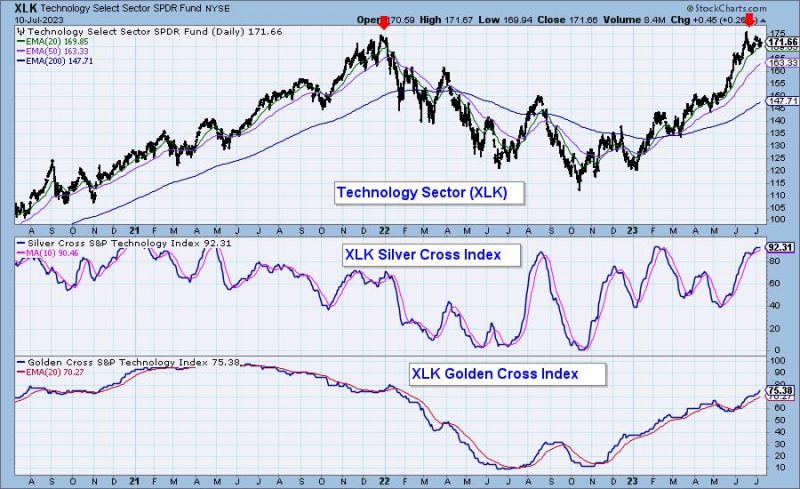
Admittedly it is early, very early to make a pronouncement that a double-top is “in”, but we do have a second top and it could be THE top. We’ve annotated the prior long-term top from 2021. Technology’s bear market began in earnest at that time. The Silver Cross Index was not as high as it is now. It is very overbought.
Granted the Golden Cross Index is rising and could rise higher. Many of the stocks within the sector have EMAs that are configured as XLK. Price is well above both the 50/200-day EMAs. The loss of a Golden Cross requires price to move below the 200-day EMA, that is a long way down for many of the very overbought stocks within Technology.
We have a bearish Adam & Eve double-top in the short-term on XLK that suggests at the very least a pullback. The PMO is in decline after bearishly topping beneath the signal line. Participation is holding strong, but is overbought in all timeframes. Nowhere left for those indicators to go except down.
Conclusion: Technology is very overbought and we could be looking at a long-term double-top. At a minimum we have a short-term double-top that suggests a pullback. We will want to watch the Silver Cross Index closely, if we see a drop beneath the signal line it will be character change or “bearish shift”.
Subscribers have access to the Golden Cross/Silver Cross Indexes for nine indexes, 11 sectors and five industry groups.
Get Two Weeks FREE!
Come try out the DecisionPoint Alert and DecisionPoint Diamonds reports for free! Just use coupon code: DPTRIAL2 and you get two free weeks! Cancel at anytime.
Learn more about DecisionPoint.com:
Watch the latest episode of DecisionPoint on StockCharts TV’s YouTube channel here!
Technical Analysis is a windsock, not a crystal ball. –Carl Swenlin
(c) Copyright 2023 DecisionPoint.com
Helpful DecisionPoint Links:
DecisionPoint Alert Chart List
DecisionPoint Golden Cross/Silver Cross Index Chart List
DecisionPoint Sector Chart List
Price Momentum Oscillator (PMO)
Swenlin Trading Oscillators (STO-B and STO-V)
DecisionPoint is not a registered investment advisor. Investment and trading decisions are solely your responsibility. DecisionPoint newsletters, blogs or website materials should NOT be interpreted as a recommendation or solicitation to buy or sell any security or to take any specific action.


