How to Use Technical Indicators for Stock Market Analysis
Technical indicators are essential tools for stock market analysis. They help traders and investors make informed decisions by providing valuable insights into market trends and potential price movements. By understanding how to use technical indicators effectively, you can improve your trading strategies and increase your chances of success in the stock market. In this article, we will discuss some of the most commonly used technical indicators and how you can use them to analyze stock market trends.
Moving Averages
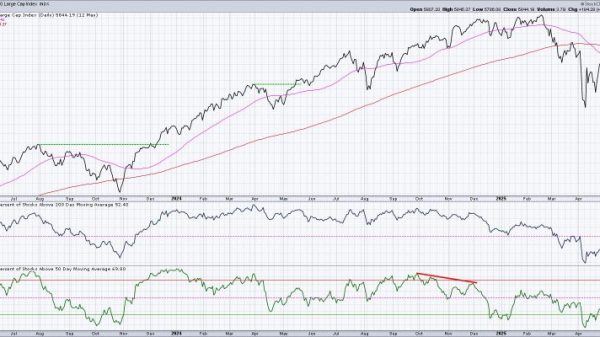
Moving averages are one of the simplest and most widely used technical indicators in stock market analysis. They smooth out price data and help traders identify trends by following the average price of a security over a specific period of time. Moving averages can be simple, exponential, or weighted, depending on the calculation method used. Traders often look for crossovers between short-term and long-term moving averages to identify potential trend reversals or continuations.
Relative Strength Index (RSI)
The Relative Strength Index (RSI) is a momentum oscillator that measures the speed and change of price movements. RSI values range from 0 to 100, with readings above 70 indicating overbought conditions and readings below 30 indicating oversold conditions. Traders often use the RSI to identify potential trend reversals and confirm the strength of a trend. Divergences between the RSI and price movements can also provide valuable signals about potential market reversals.
Bollinger Bands
Bollinger Bands are volatility indicators that consist of a simple moving average and two standard deviation bands. The bands expand and contract based on market volatility, with prices typically staying within the bands during normal market conditions. Traders use Bollinger Bands to identify overbought and oversold conditions, as well as potential trend reversals. Breakouts above or below the bands can signal the beginning of a new trend.
Moving Average Convergence Divergence (MACD)
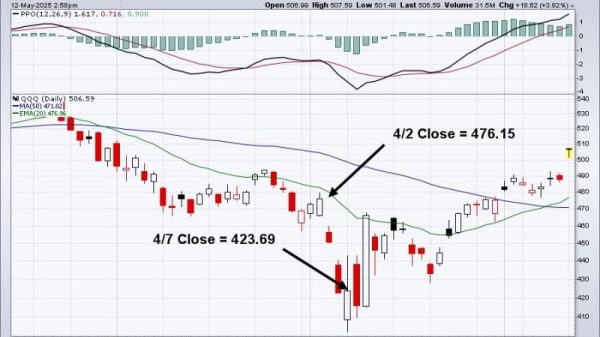
The Moving Average Convergence Divergence (MACD) is a trend-following momentum indicator that shows the relationship between two moving averages of a security’s price. The MACD line is calculated by subtracting the 26-period exponential moving average from the 12-period exponential moving average. Traders use the MACD line, signal line, and histogram to identify trend direction, momentum, and potential buy or sell signals.
In conclusion, technical indicators are powerful tools that can help traders analyze stock market trends and make informed decisions. By understanding how to use moving averages, the RSI, Bollinger Bands, and the MACD effectively, you can improve your trading strategies and increase your chances of success in the stock market. Remember to use technical indicators in conjunction with other forms of analysis and risk management strategies to maximize your trading profits and minimize potential losses.


