


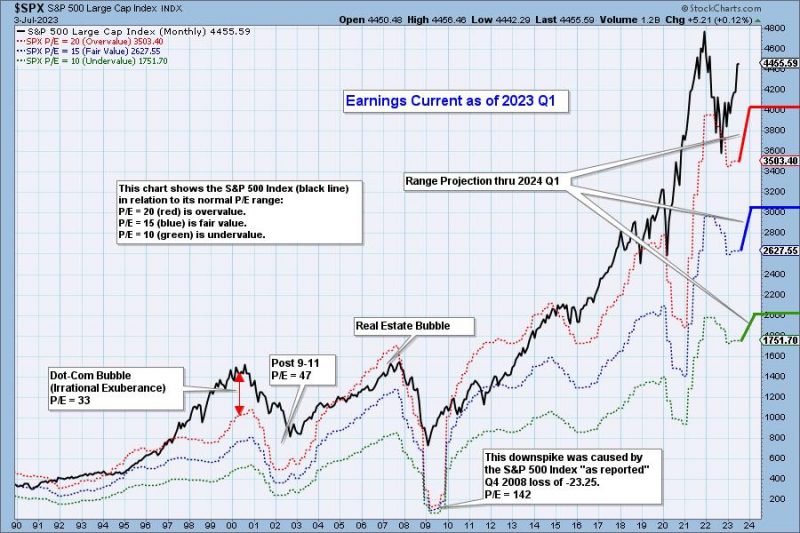
The following chart shows the normal value range of the S&P 500 Index, indicating where the S&P 500 would have to be in order to have an overvalued P/E of 20 (red line), a fairly valued P/E of 15 (blue line), or an undervalued P/E of 10 (green line). Annotations on the right side of the chart show where the range is projected to be based upon earnings estimates through 2024 Q1.
Historically, price has usually remained below the top of the normal value range (red line); however, since about 1998, it has not been uncommon for price to exceed normal overvalue levels, sometimes by a lot. The market has been mostly overvalued since 1992, and it has not been undervalued since 1984. We could say that this is the “new normal,” except that it isn’t normal by GAAP (Generally Accepted Accounting Principles) standards.
We use GAAP earnings as the basis for our analysis. The table below shows earnings projections through December 2023. Keep in mind that the P/E estimates are calculated based upon the S&P 500 close as of March 31, 2023. They will change daily depending on where the market goes from here. It is notable that the P/E is again outside the normal range.
The following table shows where the bands are projected be, based upon earnings estimates through 2024 Q1.
This DecisionPoint chart keeps track of S&P 500 fundamentals, P/E and yield, and it is updated daily — not that you need to watch it that closely, but it is up-to-date when you need it.
CONCLUSION: The market is still very overvalued and, with a P/E of 25.44, well above the normal range. Earnings have ticked up, breaking the down trend of the prior three quarters, and they are estimated to be higher for the next four quarters. Being overvalued doesn’t require an immediate decline to bring valuation back within the normal range, but high valuation applies negative pressure to the market environment.
Watch the latest episode of DecisionPoint on StockCharts TV’s YouTube channel here!
(c) Copyright 2023 DecisionPoint.com
Technical Analysis is a windsock, not a crystal ball.
Helpful DecisionPoint Links:
DecisionPoint Alert Chart List
DecisionPoint Golden Cross/Silver Cross Index Chart List
DecisionPoint Sector Chart List
Price Momentum Oscillator (PMO)